
Datadog Startup Credits: $2,000 in credits
Monitor your infrastructure, applications, and logs with the leading observability platform for cloud-scale applications.
Free · Opens in new tab
Already have an account? Log in
Deal Highlights
What Is Datadog?
Datadog is the cloud monitoring and observability platform that unifies infrastructure metrics, application performance monitoring (APM), log management, real-user monitoring (RUM), and security monitoring in a single dashboard. Used by over 26,000 companies in 2026, Datadog provides the visibility layer that engineering teams need to understand what their systems are doing and what is going wrong, across every layer of the stack.
For startups running production services, Datadog answers the questions that keep CTOs awake: Is the API slow? Which database query is causing the latency spike? Did the latest deploy introduce a memory leak? Which users are experiencing errors? Without observability, these questions require hours of log searching and guesswork. With Datadog, they require a dashboard glance.
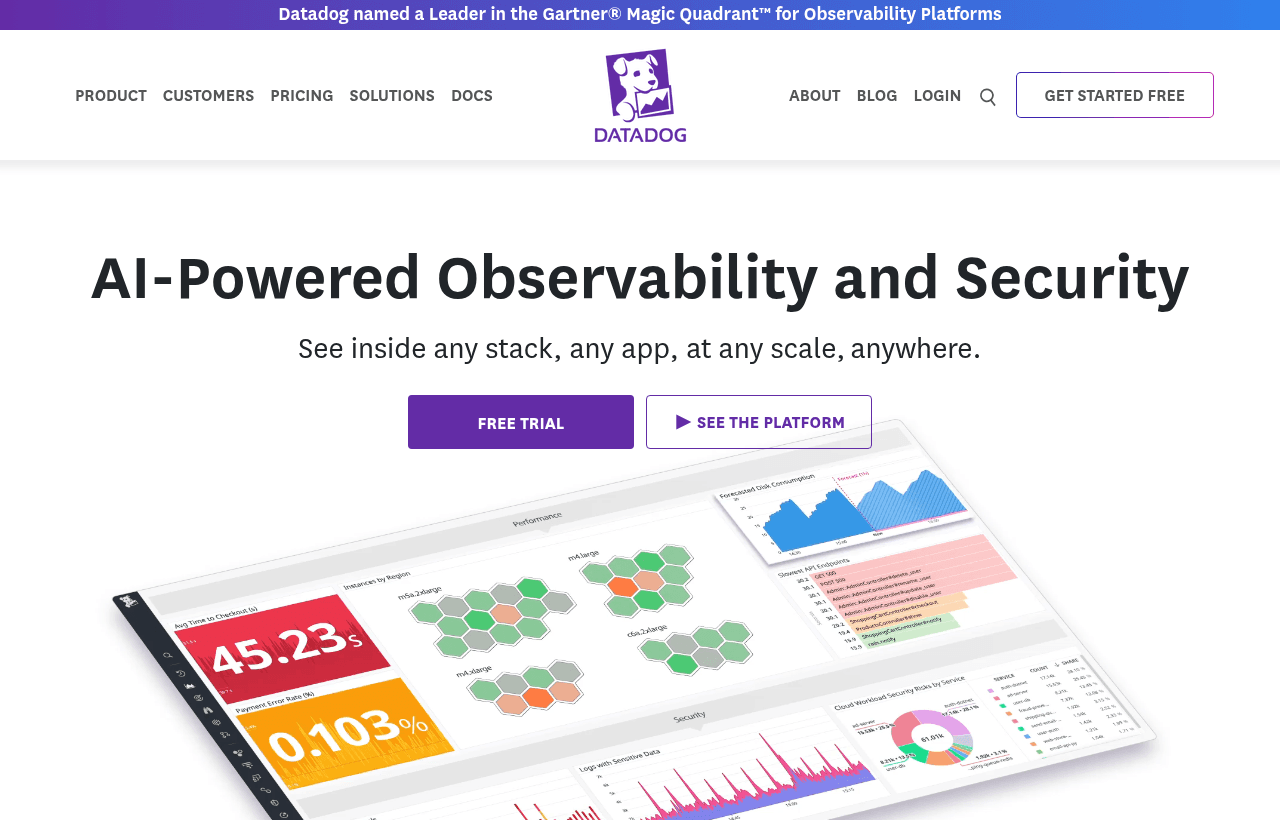
Datadog, one of the tools included in this startup deal.
Why This Deal Matters for Startups
Production incidents cost more than Datadog subscriptions. A 30-minute outage during a product demo costs a deal. A slow API that frustrates users during their trial period costs conversions. A memory leak discovered after 3 days of customer complaints costs trust.
Datadog's startup credit program provides $2,000 in credits, enough to run thorough monitoring for 4–8 months at early-stage infrastructure scale. The alternative is flying blind through the most critical phase of product development.
What's Included in the Datadog Startup Deal
Through SaaSOffers, qualifying startups receive:
- $2,000 in Datadog credits
- Infrastructure monitoring: Host metrics, container metrics, serverless monitoring
- APM (Application Performance Monitoring): Distributed tracing, service maps, error tracking
- Log management: Centralized log collection, search, and analysis
- Real User Monitoring: Frontend performance from real user sessions
- 750+ integrations: AWS, GCP, Kubernetes, PostgreSQL, Redis, and more
- Alerting: PagerDuty, Slack, email notifications for anomalies
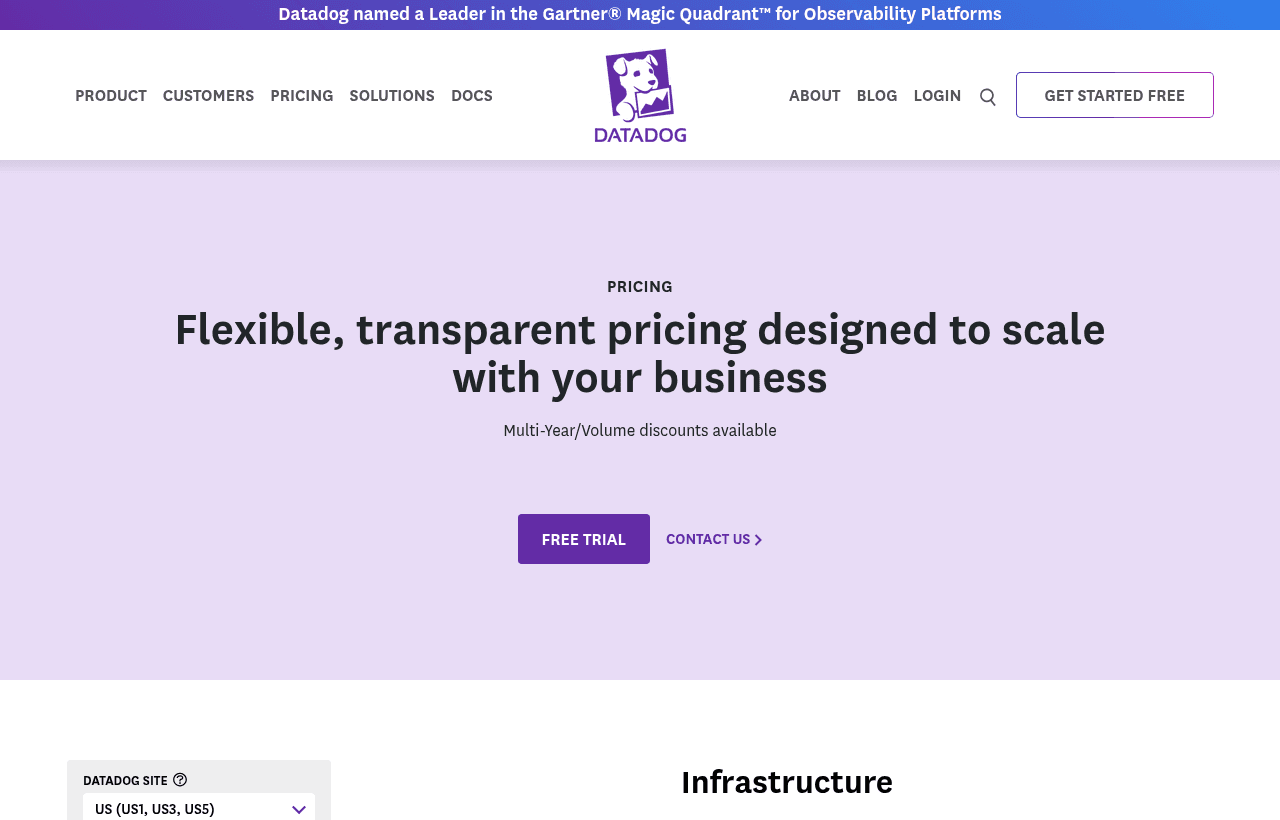
A look at Datadog before the discount, so you can see what the deal saves you.
Eligibility Requirements
- Early-stage startup, new Datadog account
- Running production infrastructure (or preparing to launch)
- Applied through a qualifying startup platform
How to Claim This Datadog Deal. Step by Step
Step 1: Create a free account on SaaSOffers at saasoffers.tech and access the Datadog startup deal.
Step 2: Click "Get Deal" and follow the link to Datadog's startup program application.
Step 3: Create your Datadog account at datadoghq.com. Install the Datadog Agent on your servers, containers, or serverless functions.
Step 4: Configure your first integrations. AWS CloudWatch, PostgreSQL, Redis, and your application framework. Most integrations are one-click in the Datadog dashboard.
Step 5: Set up APM tracing in your application. Add the Datadog tracing library to your backend service to capture request traces, database query timing, and external API call performance.
Step 6: Create your first dashboard with the 4 golden signals: latency (p50, p95, p99), traffic (requests per second), errors (error rate), and saturation (CPU, memory, disk).
Step 7: Configure alerts for critical thresholds, error rate above 1%, p99 latency above 2 seconds, disk usage above 80%. Route alerts to Slack for awareness and PagerDuty for on-call response.
Key Features of Datadog for Startups
Infrastructure Monitoring
Datadog collects metrics from every layer of your infrastructure, host CPU, memory, disk, network; container resource usage; serverless invocation counts and duration; database connection pools and query performance. A single dashboard shows the health of your entire system without SSH-ing into individual servers.
APM. See Inside Every Request
Distributed tracing follows a single user request through your entire system, from the frontend, through the API gateway, into the application server, across database queries, through cache layers, and out to external API calls. When a request is slow, the trace shows exactly which component caused the latency.
Log Management. Search All Logs in One Place
Datadog Log Management collects logs from all sources (application, infrastructure, cloud services), indexes them for full-text search, and correlates them with metrics and traces. Instead of SSH-ing into three servers and grep-ing log files, search across all logs from one interface.
Alerting and On-Call
Datadog's alerting system monitors metrics, logs, and traces for anomalies and threshold breaches. Alerts integrate with PagerDuty, OpsGenie, Slack, and email. Composite alerts combine multiple conditions, "error rate above 5% AND request volume above 100/second", to reduce false positives.
750+ Integrations
Datadog integrates with virtually every service a startup uses: AWS (50+ services), Google Cloud, Kubernetes, Docker, PostgreSQL, MySQL, Redis, MongoDB, Nginx, and application frameworks for Python, Node.js, Go, Java, Ruby, and .NET.
Datadog vs Grafana Cloud vs New Relic
| Factor | Datadog | Grafana Cloud | New Relic |
|---|---|---|---|
| Infrastructure monitoring | Excellent | Excellent | Good |
| APM | Excellent | Good (Tempo) | Excellent |
| Log management | Excellent | Excellent (Loki) | Good |
| Free tier | 14-day trial | Generous free tier | 100GB/month free |
| Pricing model | Per host + per feature | Per metric series | Per GB ingested |
| Startup credits | $2,000 | Free tier sufficient | $500 |
| Ease of setup | Easiest | Moderate | Easy |
Datadog wins on unified experience (all observability in one tool), ease of setup, and integration breadth. Grafana Cloud wins on cost (generous free tier, open-source option). New Relic wins on per-GB pricing transparency for log-heavy workloads.
Who Is the Datadog Deal For?
Startups running production services with real users: The moment you have users depending on your service, you need monitoring. Datadog provides the fastest path from "no monitoring" to "complete observability", typically under 2 hours for a full setup.
Engineering teams debugging performance issues: If your team spends more than 30 minutes per week investigating slow requests, errors, or infrastructure issues, Datadog's APM and log correlation pay for themselves in recovered engineering time.
Startups preparing for enterprise customers: Enterprise customers ask about your monitoring, incident response, and SLA compliance. "We use Datadog for observability" is a credible answer that checks the box on technical due diligence.
Real Startup Use Cases
PayFlow (fintech API): PayFlow used Datadog APM to trace payment processing requests through 4 microservices. When a customer reported intermittent payment failures, the distributed trace revealed a 3-second timeout in their bank API integration that only occurred during peak hours. Fix time: 45 minutes from report to deploy. Without APM, estimated debug time: 4–8 hours.
DeployBot (CI/CD platform): DeployBot monitored their Kubernetes cluster with Datadog, container resource usage, pod scheduling latency, and node health. A Datadog anomaly alert caught a memory leak in their build worker service 2 hours after a deploy, before any customer reported issues. The alert included the exact container, the memory growth rate, and a link to the relevant logs.
DataSync (data integration): DataSync used Datadog Log Management to centralize logs from 12 microservices processing 50,000 data sync operations per day. When a customer's sync failed, searching correlated logs across all services took 30 seconds in Datadog versus the previous approach of checking CloudWatch logs in 4 separate AWS accounts.
Tips to Maximize Your Datadog Credits
- Start with infrastructure monitoring only, add APM second. Infrastructure metrics are the foundation. APM tracing adds the most value but also the most cost. Get infrastructure dashboards running first, then add APM to your 2–3 most critical services.
- Use log filtering to control costs. Datadog charges by indexed log volume. Configure log pipelines to filter out debug-level logs and high-volume health check logs before indexing. Index only logs that are useful for debugging and compliance.
- Set up the 4 golden signals dashboard immediately. Latency, traffic, errors, saturation. This single dashboard catches 80% of production issues. Build it in your first hour on Datadog.
- Configure alerts with appropriate thresholds. Alerts that fire too often get ignored. Start with conservative thresholds (error rate above 5%, p99 latency above 5 seconds) and tighten them as you learn your system's normal behavior.
- Use Datadog's cost estimation tools. The Datadog console shows estimated monthly cost based on current usage. Check this weekly during your first month to ensure you are within your credit budget.
Datadog Alternatives
Looking for Datadog alternatives? While Datadog is a strong choice for developer tools, it is not always the right fit for every team. Compare Datadog against the top alternatives in our category. Each with verified startup deals and credits. See all Datadog alternatives →
Many startups end up using a combination of tools, and there are no restrictions on claiming multiple deals through SaaSOffers. Whether you need a cheaper option, different features, or a better startup deal, there is an alternative worth considering.
The Datadog Bill Is the Real Story
No discussion of Datadog is honest without addressing its cost, because the platform is as well known for surprise bills as for its capabilities, and understanding why is essential before you adopt it.
Datadog charges across many separate product lines, each metered differently, and they add up in ways teams do not anticipate. Infrastructure monitoring is priced per host. Log management is priced by volume ingested and, separately, by volume indexed for search. Application performance monitoring is priced per host again. Custom metrics are billed by the number of unique metric-plus-tag combinations, which can explode without anyone noticing. Synthetic tests, real-user monitoring, and the other modules each have their own meter. The result is that a bill can arrive several times larger than expected, because each capability you switched on was priced independently.
The specific traps are worth naming. Custom metric cardinality is the classic one: attaching a high-cardinality tag, a user ID, a request ID, to a metric multiplies the billable metric count enormously. Log indexing is another: ingesting logs is one cost, but indexing all of them for search is a much larger one, and indexing everything by default is expensive and usually unnecessary. Per-host pricing in dynamic environments catches teams whose host count scales up under load, because the bill scales with it.
The discipline that controls this is the same across all of it: be deliberate about what you collect and retain. Index the logs you will actually search and archive the rest. Watch custom metric cardinality and avoid high-cardinality tags unless you need them. Turn on the modules you use rather than all of them. Set billing alerts and review usage regularly. Datadog is genuinely powerful, and it rewards teams who treat cost as something to manage actively rather than discover on the invoice. For a startup, the credit is valuable precisely because it buys time to learn the platform's cost behavior before you are paying full price for it.
Is Datadog Right for a Startup Yet?
Datadog is the most capable observability platform available, and capability is not the same as fit, so the honest question for a startup is whether you need this much yet.
The platform earns its place when you have real infrastructure complexity: many services, significant scale, a need to correlate metrics, logs, and traces across a distributed system, and a team that will use the depth. At that point, having everything in one powerful platform is worth the cost and the learning curve, and Datadog is the leader for good reason.
Earlier, the calculus is different. A small startup with a couple of services can get most of the observability value it needs from lighter, cheaper tools, or from the generous free tiers of open-standards platforms, without the cost exposure and complexity Datadog brings. Adopting the most powerful observability platform before your infrastructure justifies it means paying for and managing capability you will not use, and risking the bill surprises the platform is known for.
The sensible path for many startups is to start with something simpler and move to Datadog when infrastructure complexity genuinely warrants it, using a startup credit to evaluate and ease the transition. The credit makes trying Datadog low-risk; the ongoing commitment is the decision to make deliberately, matched to where your systems actually are rather than to where you hope they will be.
The practical takeaway is to treat the startup credit as a learning budget: instrument one real service across metrics, logs, and traces, watch exactly how each product line accrues cost on your own workload, and set the collection and indexing discipline before the credit runs out and full pricing begins.
Who Is This Deal For?
Early-Stage Startups
Seed and pre-seed companies looking to move fast without overspending on tools.
Growing SaaS Teams
Series A+ companies scaling their stack and optimizing software costs.
Solo Founders
Indie hackers and bootstrapped founders who need enterprise tools at startup prices.
Get $2,000 in credits off Datadog
Premium deal. Upgrade once, unlock everything.
Frequently Asked Questions
Everything you need to know about this startup deal.
Datadog pricing is per-host and per-feature. Infrastructure monitoring starts at $15/host/month. APM adds $31/host/month. Log management starts at $0.10/GB indexed. For a startup with 3–5 hosts using infrastructure + APM, expect $150–$300/month. The $2,000 startup credit covers 6–13 months at this usage level.
Get the weekly deals digest
New verified startup deals every week. No spam, ever. Unsubscribe anytime.
Related Offers

Toggl Track
Used by 1,100 members
Free Plan
Simple and intuitive time tracking for teams with reporting and integrations.
View offer
Auth0
Used by 994 members
1 year of B2B Professional free
Get 1 year of the Auth0 B2B Professional plan free, with up to 100,000 monthly active users, SSO, enterprise MFA and SCIM.
View offer
Bugsnag
Used by 471 members
Free Plan
Error monitoring and stability management for web and mobile applications.
View offer
Turborepo
Used by 1,880 members
Free & Open Source
High-performance build system for JavaScript and TypeScript monorepos by Vercel.
View offer
Windmill
Used by 1,501 members
Free Plan
Open-source developer platform for building internal tools, workflows, and scripts.
View offer
Height
Used by 1,442 members
Free Plan
AI-powered project management tool with autonomous task management and workflows.
View offerDeal Summary
Looking for more startup deals?
Browse all offers