
Amplitude Promo Code: 1 year free
Get 1 year free on Amplitude, the digital analytics platform that helps 3,000+ teams understand user behavior, run experiments, and build better products.
Free · Opens in new tab
Free · No account required. Sign up to track your deals.
Deal Highlights
What Is Amplitude?
Amplitude is the leading product analytics platform used by over 3,000 companies, from early-stage startups to public enterprises, to understand how users interact with their products. Founded in 2012, Amplitude has become the default choice for product teams that want to move beyond vanity metrics and make decisions grounded in real behavioral data.
In 2026, Amplitude continues to dominate the product analytics space by offering not just event tracking, but a full behavioral intelligence suite: user journey mapping, cohort analysis, retention analysis, A/B experiment tracking, and predictive forecasting. If you're building a digital product, Amplitude answers the most important questions: Who are your best users? Where do people drop off? Which features drive retention? What predicts churn?
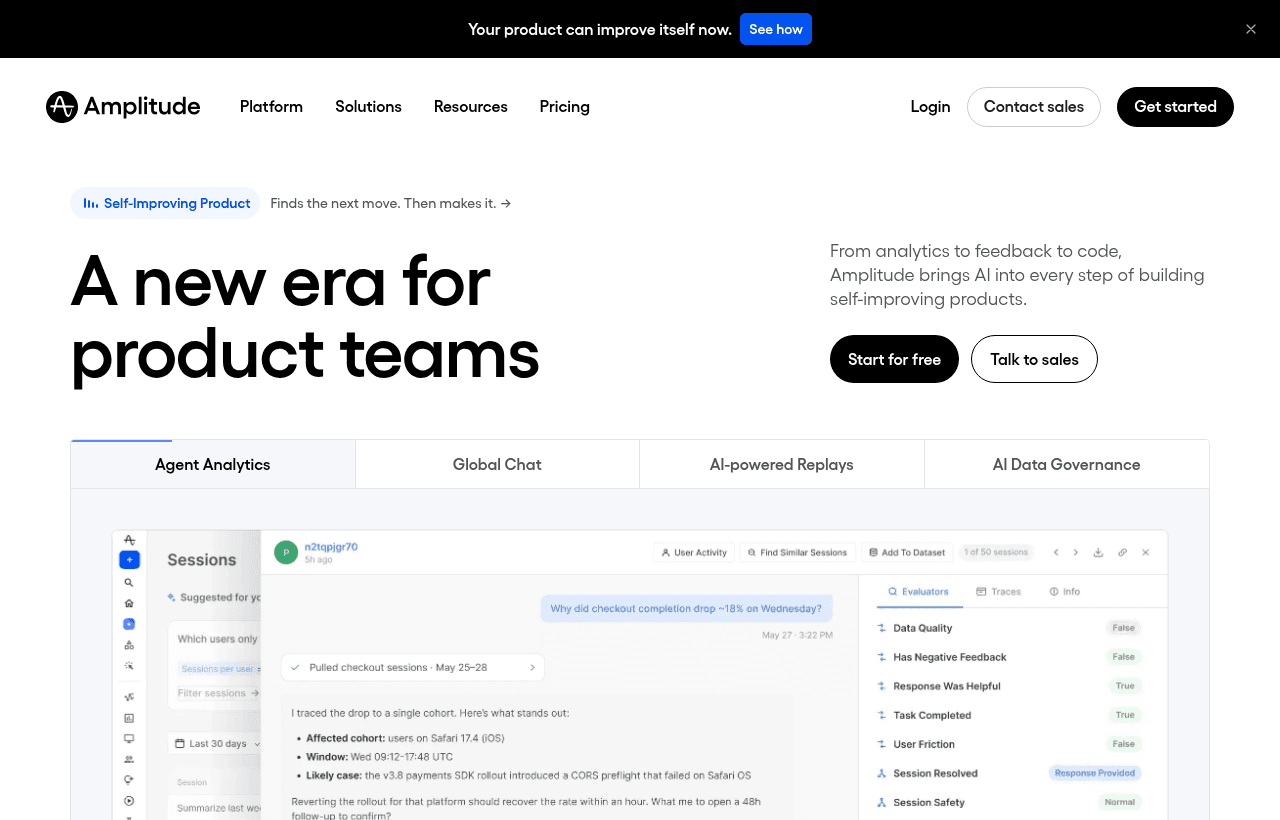
Amplitude, one of the tools included in this startup deal.
Why This Deal Matters for Startups
Most analytics tools are either too simple (Google Analytics surface-level traffic data) or too expensive (enterprise analytics suites charging $5,000+/month). Amplitude's startup deal bridges that gap, giving early-stage teams full access to the same platform used by Notion, Twitter, and Dropbox at zero cost.
In 2026, data-driven product development isn't optional for startups, it's a competitive requirement. Investors expect it. Users expect products that improve continuously. The Amplitude startup program removes the financial barrier so your team can build the analytics foundation that enterprise products spend years establishing.
What's Included in the Amplitude Startup Deal
Through SaaSOffers, qualifying startups receive:
- Free Scholarship Plan: 10 million monthly events at no cost
- Access to core Amplitude features: Behavioral graphs, cohort analysis, retention charts, funnel analysis, and user journey maps
- Amplitude Experiment: A/B testing integrated directly with your analytics events
- Data management tools: Data governance, schema enforcement, and property definitions
- Priority onboarding: Access to Amplitude's startup success resources and documentation
This represents significant value compared to Amplitude's standard Growth Plan, which starts at $995/month at equivalent usage levels.
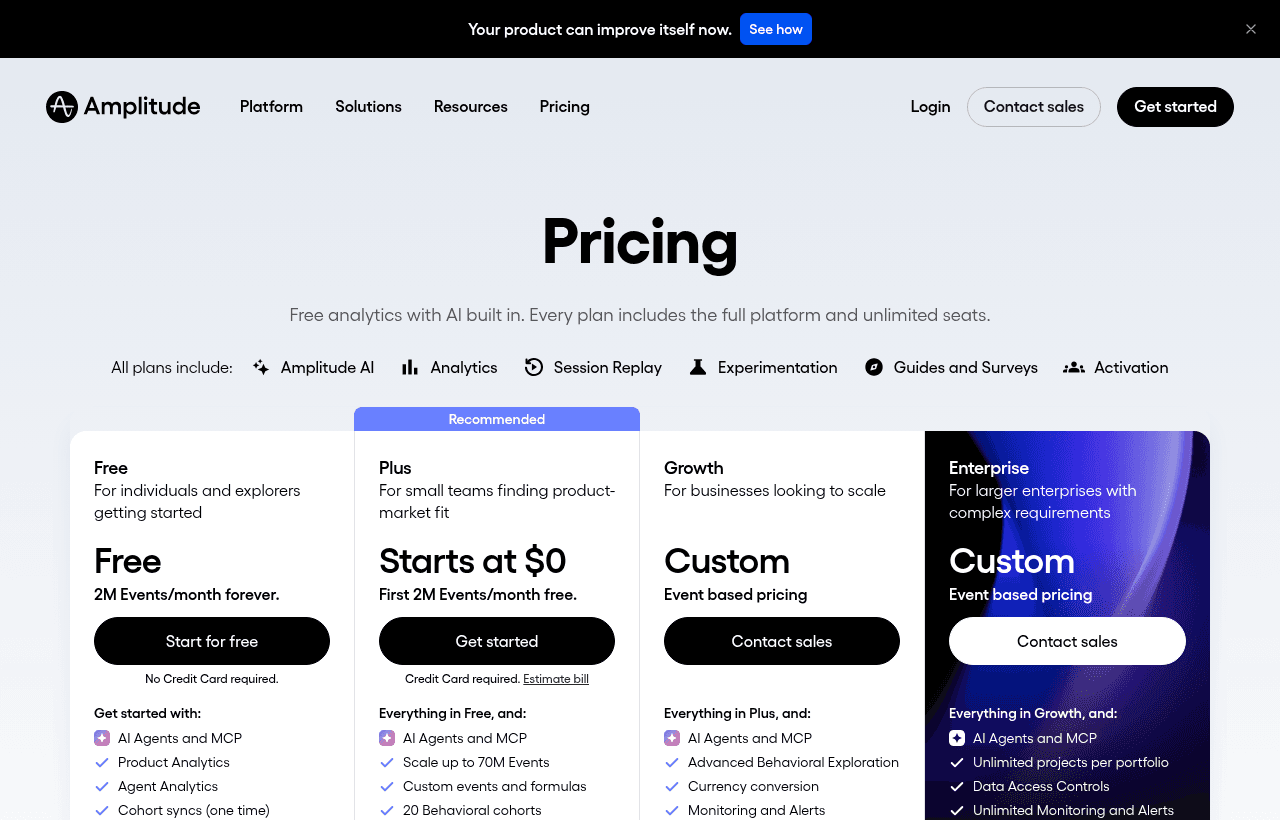
A look at Amplitude before the discount, so you can see what the deal saves you.
Eligibility Requirements
The Amplitude startup scholarship is available to companies that:
- Have raised less than $5 million in total funding (Seed or Series A)
- Are fewer than 5 years old
- Are not current Amplitude paying customers
- Have a working product or active development (not pre-MVP)
Eligibility is verified during the application process. Apply early. This deal is offered on a rolling basis with periodic capacity limits.
How to Claim This Amplitude Deal. Step by Step
Step 1: Create a free account on SaaSOffers at saasoffers.tech. This verifies your startup's eligibility and generates your referral link.
Step 2: Click "Get Deal" on the Amplitude offer page and follow the link to Amplitude's startup program application.
Step 3: Fill out the application with your company name, funding stage, product URL, and number of monthly active users.
Step 4: Install the Amplitude SDK (available for iOS, Android, Web, Node.js, Python, and more) in your product. Use the Quickstart guides in the Amplitude documentation to send your first events within minutes.
Step 5: Define your core events. Work with your team to identify the 10–20 events that matter most to your product, signups, activations, key feature interactions, and conversions.
Step 6: Build your first dashboard. Start with a retention curve and a conversion funnel. These two charts will immediately surface the most important insights about your product.
Step 7: Set up Amplitude Experiment if you plan to run A/B tests. Connect experiment variants to outcome events so you can measure the true impact of every product change.
Key Features That Make Amplitude Powerful
Behavioral Cohort Analysis
Amplitude lets you define cohorts based on any combination of actions, properties, and time windows. You can compare "users who completed onboarding in under 5 minutes" vs "users who took longer" across every metric in your product and export those cohorts to your CRM or email tool for targeted campaigns.
Retention Analysis at Depth
Unlike simple "day 1 / day 7 / day 30" retention metrics, Amplitude's retention analysis is fully customizable. Define what "retained" means for your product, returning to use a specific feature, completing a key workflow, or reaching a usage threshold and measure retention against that definition.
Funnel Analysis With Conversion Windows
Amplitude's funnel analysis supports flexible conversion windows, multi-path funnels, and breakdown by user property. See exactly where users drop off, how long they take to convert, and whether the drop-off rate differs by cohort, device, or traffic source.
Amplitude Experiment. Native A/B Testing
Most analytics platforms force you to connect third-party experimentation tools and manually join data. Amplitude Experiment is built into the same platform as your analytics, so A/B test results are immediately analyzable against every behavioral metric in your product without any data pipeline work.
Predictive Analytics and Forecasting
Amplitude's AI-powered predictions (available on Growth plans) predict which users are likely to convert, churn, or return, allowing product and growth teams to take proactive action before users leave. In 2026, this predictive layer is one of Amplitude's most differentiated capabilities.
Amplitude vs. Competitors: How It Compares
| Platform | Best For | Free Tier | Strengths | Weaknesses |
|---|---|---|---|---|
| Amplitude | Product analytics depth | 10M events/mo | Cohorts, retention, native A/B | Less raw-data access |
| Mixpanel | Event tracking simplicity | 20M events/mo | Simple queries, wide integrations | Fewer predictive features |
| Heap | Auto-capture everything | Limited | No-code retroactive analysis | Expensive at scale |
| PostHog | Open-source self-hosted | Unlimited (self-hosted) | Full data control, session replay | More DevOps overhead |
| Google Analytics | Traffic & SEO monitoring | Unlimited | Free, widely understood | Not built for product analytics |
Amplitude wins for startups building complex products where understanding user behavior depth matters more than simplicity. Mixpanel is a strong alternative for simpler funnels. PostHog is ideal for teams that want to self-host and own all data.
Who Is This Amplitude Deal For?
Product Managers who are flying blind: If your product decisions are currently based on gut feel and user interviews rather than behavioral data, Amplitude will transform how you prioritize features. The funnel and retention views alone will reshape your roadmap within the first month.
Growth Engineers running experiments: Amplitude Experiment gives you a professional A/B testing framework without paying for Optimizely or LaunchDarkly. If you're running 10+ experiments per quarter, native experiment-to-analytics connection saves hours of analysis work per test.
SaaS Founders preparing for a Series A: Investors in 2026 expect founders to know their activation rate, day-30 retention, and conversion funnel performance. Amplitude makes it possible to walk into a fundraising meeting with precise, credible data on every stage of your user journey.
Real Startup Use Cases
Taskflow AI (project management SaaS, 4,000 MAU): Taskflow's team used Amplitude to discover that users who created their first project within 10 minutes of signup had 3x better 30-day retention. They redesigned onboarding around that insight and improved new user activation by 40% in one quarter.
MediSync (healthcare scheduling platform, Series A): MediSync used Amplitude cohort analysis to identify that enterprise customers who used 3+ integrations churned at less than half the rate of those using 1. The finding drove a product decision to make integration setup part of the core onboarding flow, directly impacting NRR.
GrowthBase (B2B SaaS analytics tool, pre-revenue): GrowthBase's founders used Amplitude to track beta user behavior from day one. When they pitched their Series A, they walked investors through a live Amplitude dashboard showing feature adoption curves, retention benchmarks, and A/B test results. A differentiated fundraising approach that helped close the round in three weeks.
Tips to Maximize Your Amplitude Scholarship
- Track events from day one. Don't wait until your product is "ready" to add analytics. Every day of missing data is a permanent gap in your behavioral history. Instrument tracking on the first day of production use.
- Start with outcomes, not activities. Your most important events are the ones that represent value delivered: a report generated, a connection made, a task completed. Build your event taxonomy around outcomes rather than clicks.
- Use property definitions immediately. Amplitude's data management tools let you define what each event property means. Do this early to prevent event schema chaos as your team grows and adds tracking independently.
- Connect Amplitude to your CRM. Amplitude integrates with HubSpot, Salesforce, and Braze. Syncing behavioral cohorts to your CRM allows sales and CS teams to act on product usage signals in real time.
- Review your session replays with FullStory or Hotjar alongside Amplitude. Amplitude tells you what users do in aggregate; session replay tools tell you why specific users struggled. Together, they create a complete picture of user experience.
Event Volume: The Number That Drives Your Bill
Amplitude prices around tracked events and monthly tracked users, so instrumentation decisions are budget decisions.
The common failure is tracking everything on the theory that data might be useful later. A team instruments every click, hover, and scroll, generates enormous event volume, and then discovers that the analysis they actually run depends on perhaps fifteen events. The rest is noise you paid to store.
Start from questions, not from the interface. Write down the five to ten decisions you want data to inform, then instrument only the events those decisions require. Signup started, signup completed, activation milestone reached, key feature used, subscription started, subscription cancelled. That set answers most early-stage questions.
Use properties instead of separate events. Rather than creating clicked_export_csv, clicked_export_pdf, and clicked_export_json, track one export_performed event with a format property. You get the same analytical granularity at a third of the event volume and a far cleaner taxonomy.
Instrumentation Mistakes That Ruin the Data
Analytics fails more often from bad implementation than from choosing the wrong vendor.
Inconsistent naming is the most common. When one engineer sends User Signed Up and another sends user_signup, they become two unrelated events. Agree on a convention, write it down, and enforce it in code review before the first event ships.
No identity resolution breaks every funnel you care about. If anonymous visitors are not linked to their account after signup, the journey from landing page to conversion is split across two users who look unrelated. Call the identify method at signup and login.
Tracking only in production, only in the client. Client-side tracking loses events to ad blockers and network failures, commonly 10% to 30% of traffic. Send revenue and lifecycle events server-side where accuracy matters.
Never auditing. Instrumentation rots as the product changes. A quarterly review that removes dead events and fixes broken ones keeps both the data and the invoice under control.
Your First Two Weeks
Treat the free year as a setup window rather than a trial, because the value compounds only after instrumentation is right.
Week one: define your activation event. This is the single action that best predicts a user sticking around, and everything else follows from it. Instrument signup, activation, and your two or three core feature events, nothing more. Confirm identity resolution works by signing up as a test user and checking the journey stitches together.
Week two: build one retention chart and one conversion funnel from signup to activation. These two views answer most early product questions. Resist building dashboards nobody has asked for.
By the end of the month you should be able to state what percentage of signups activate and how many return in week two. If you cannot, the instrumentation is not finished, and no amount of additional tracking will fix it.
Amplitude Alternatives
Looking for Amplitude alternatives? While Amplitude is a strong choice for analytics, it is not always the right fit for every team. Compare Amplitude against the top alternatives in our category. Each with verified startup deals and credits. See all Amplitude alternatives →
Many startups end up using a combination of tools, and there are no restrictions on claiming multiple deals through SaaSOffers. Whether you need a cheaper option, different features, or a better startup deal, there is an alternative worth considering.
One caution on the free year: set a calendar reminder sixty days before it ends. Teams that build dashboards on a scholarship plan and forget the expiry date face either an abrupt loss of access or an unbudgeted renewal at list price.
Who Is This Deal For?
Early-Stage Startups
Seed and pre-seed companies looking to move fast without overspending on tools.
Growing SaaS Teams
Series A+ companies scaling their stack and optimizing software costs.
Solo Founders
Indie hackers and bootstrapped founders who need enterprise tools at startup prices.
Get 1 year free off Amplitude
Free for all startups. Claim instantly.
Frequently Asked Questions
Everything you need to know about this startup deal.
Yes — Amplitude offers a free Scholarship Plan with 10 million monthly events at no cost. For most early-stage startups, this covers full production analytics from launch through Series A. The scholarship is available to pre-Series B companies with under $5M raised.
Get the weekly deals digest
New verified startup deals every week. No spam, ever. Unsubscribe anytime.
Related Offers

Higgsfield
55% off annual Business plan
55% off an annual Higgsfield Business plan. Higgsfield is an AI video and image studio with Seedance, Kling, Veo and more in one account.
View offer
Seedance
55% off annual Business plan
55% off an annual Higgsfield Business plan with Seedance included. Seedance is ByteDance's AI video model for text, image and reference-driven clips.
View offerChromaDB
Used by 306 members
Free & Open Source
Open-source embedding database for building AI applications with semantic search.
View offer
Laxis
Used by 2,176 members
Free Plan
AI meeting assistant that records, transcribes, and generates actionable meeting notes.
View offer
Pictory
Used by 659 members
Free Trial
AI-powered video creation tool, turn text, scripts, and blogs into videos.
View offer
Segment
Used by 2,293 members
$25,000 in credits
Collect, clean, and route customer data to every tool in your stack with the leading customer data platform.
View offerDeal Summary
Looking for more startup deals?
Browse all offers